16. Dashboard
Goal: Build the final dashboard page. Add a title, buttons, and visuals.
Before you start: plan the layout
A dashboard tells a story in 5 points. Example:
- Total sales by county
- Total profit by date
- Total sales by customer
- Quantity sold by product
- Profit margin
Readers look left to right and top to bottom. Put the most important number first.
This is a guideline
Good dashboards follow the needs of the reader. Make the layout fit the task, not a fixed rule.
Step 1: Make a new page
- Click the + icon at the bottom of the canvas.
- A new page appears (Page 2).
- Double-click the page name.
- Rename it Dashboard.
Keep Page 1 as a working page. Move visuals to the dashboard page as they are ready.
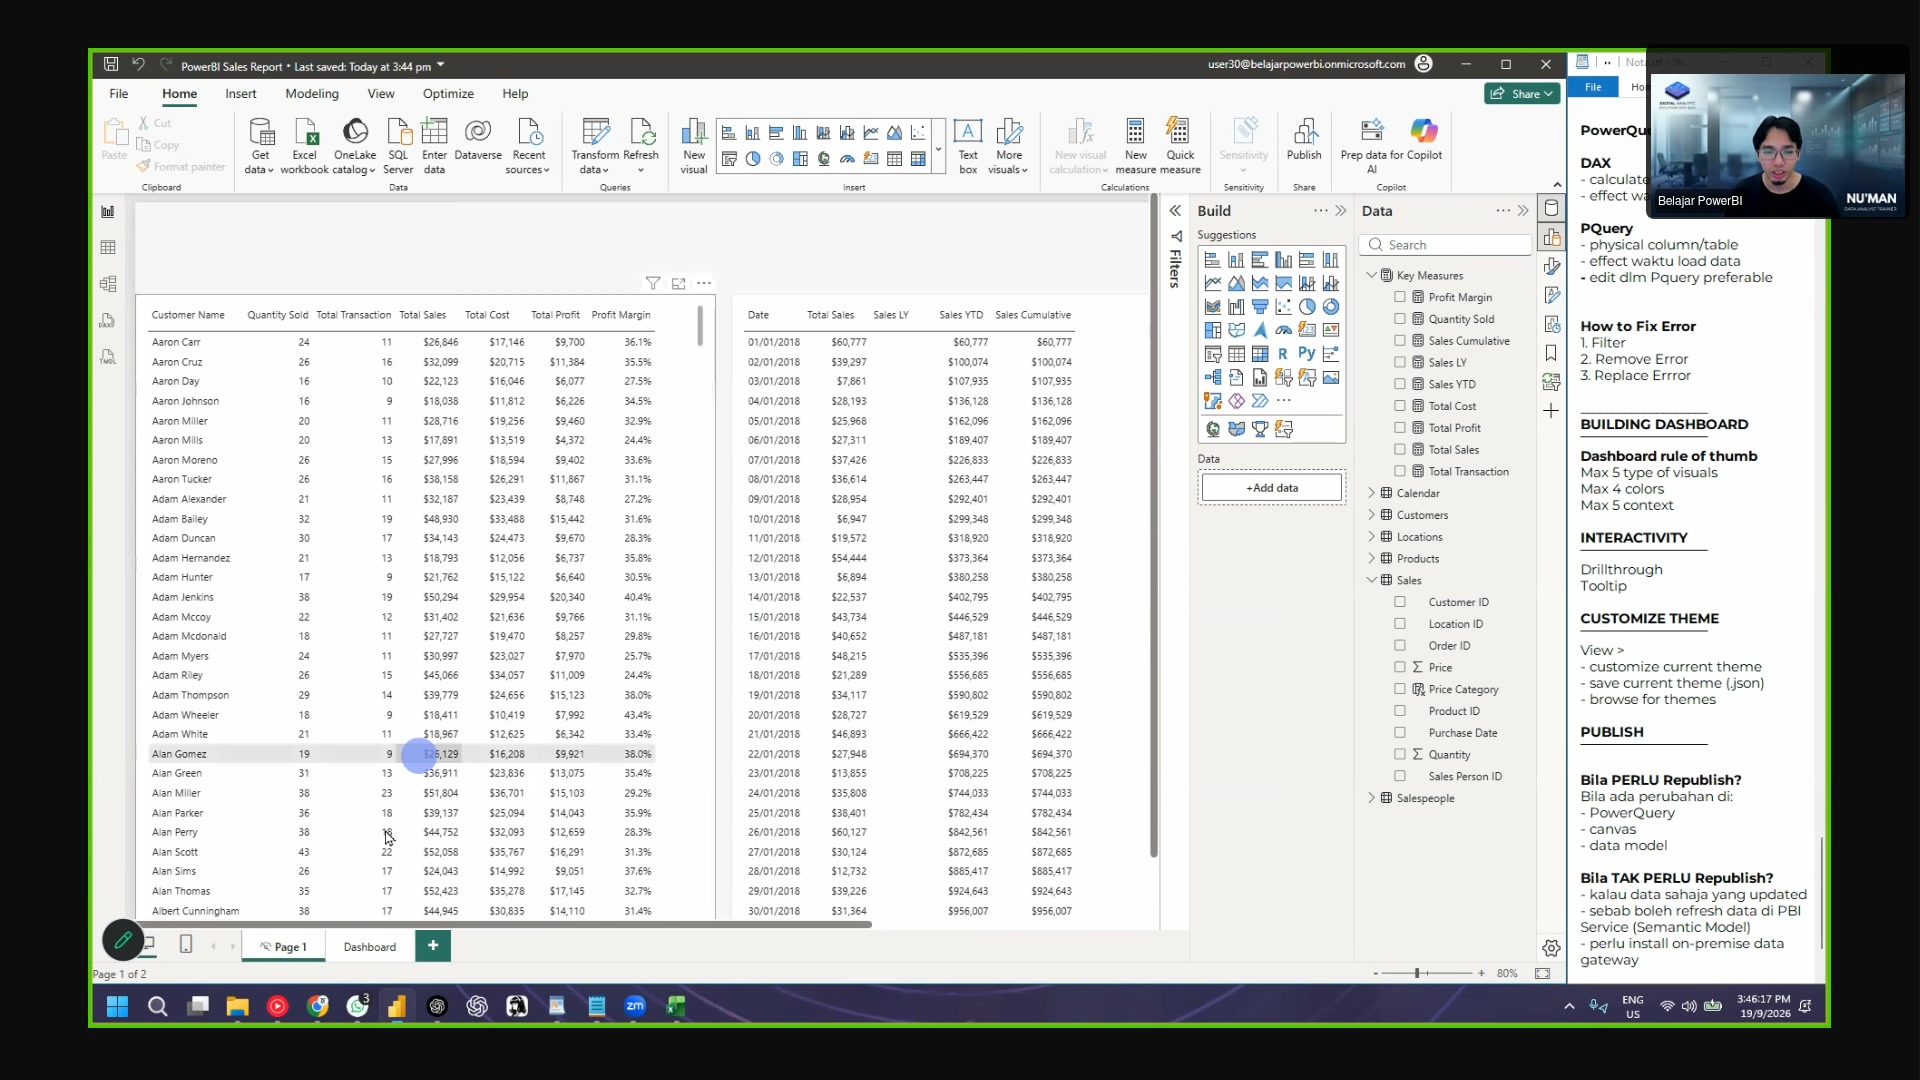 The new page, renamed to Dashboard.
Step 2: Check your view settings
- Zoom out from time to time. You see the full layout again.
- Close the Filter panel when you do not use it. It takes screen space.
- Adjust the display scale in Windows settings if the canvas looks small (Settings > Display > Scale).
Step 3: Add the title
- Click Insert > Text Box.
- Type the title. Example: Sales Dashboard 2018-2020.
- Adjust the size and the position.
- Make the box "just nice": not too big, not too small.
How to move a visual easily
Use the three-dot handle on the visual. Click and drag the handle. Dragging the middle of the visual is harder.
Step 4: Add buttons
- Click Insert > Buttons.
- Select Blank.
- Style the button in the Format panel: fill, text, icon.
- Connect the button to an action later. Example: go to a page.
Button styles (default and on hover)
The Format pane has two states:
- Default: the button look before the mouse touches it.
-
On hover: the button look when the mouse is over it.
-
In the Format pane, click Default or On hover.
- Change the fill color, text size, and icon.
No change when you hover?
You edited the wrong state. All the formatting below the state selector follows that state. Click On hover first, then change the text size.
Step 5: Add the slicer
- Click the empty space on the canvas.
- Click the Slicer icon in the Visualizations panel.
- Add the County column.
- Click a county in the slicer. All visuals on the page filter to that county.
 The quarter and year slicers as tiles. (Q1-Q4 on the left row.)
Change the slicer style
- Open the slicer Format pane.
- Select Tile style.
- Adjust the size: one row of tiles, or a grid.
Copy the slicer for more filters
Do not rebuild the slicer for each filter. Copy it:
- Click the slicer. Press Ctrl+C.
- Press Ctrl+V. A copy appears.
- In the copy, remove Quarter from the field list.
- Add Year instead.
- Drag the new slicer beside the old one.
Do the same step again for a second slicer style if you want one column per filter.
Step 6: Add KPI cards
A KPI card shows one big number. The card with the "sparkle" icon is the new style. The class uses the classic card (fewer formatting options).
- Click the empty space on the canvas.
- Click the Card icon.
- Add the Total Sales measure.
- Turn off the title.
- Set the text size to about 35.
- Set the display unit. Use the full value (millions), not the "M" short form, when the number must be clear.
Copy the card for the other KPIs
- Click the card. Press Ctrl+C, then Ctrl+V.
- Remove the data from the copy.
- Add the next measure: Quantity Sold.
- Repeat for: Total Transaction, Total Profit, Profit Margin.
All copies keep the same formatting. You change only the measure.
Align the cards
- Drag-select all five cards.
- Open Format > Align.
- Click Align center.
- Click Distribute vertically.
The cards line up with equal spacing.
Step 7: Add a map and tooltips
- Click the Map icon to add the distribution map.
- Add the county or city to the Location field.
- Add Total Sales to the size field.
- If Power BI asks about a map style, select Continue as guest.
- Hover the mouse over a map point. A tooltip shows the details.
Tooltips give extra data
The tooltip shows more data with no extra space. Example: customer count for a county.
Step 8: Add the rest of the visuals
Add the remaining visuals one by one. Put each visual in a free space.
| Visual | Field 1 | Field 2 (value) |
|---|---|---|
| Donut chart | County | Total Sales |
| Line chart | Date | Total Profit |
| Pie chart | Product Name | Total Sales |
| Bar chart | Customer Name | Total Sales |
| Bar chart | Product Name | Total Sales |
| Map | County (or Latitude/Longitude) | Total Sales |
For the map: if the county name is not enough, add the Latitude and Longitude columns from the Location table.
Every visual needs a title
The title tells the reader what the data is. Example: "Total Sales by County". Do not leave the title off.
Step 9: Align and distribute the visuals
The trainer shares this screenshot in the Zoom chat.
- Select the top three visuals (hold Ctrl and click each one).
- Open Format > Align.
- Click Align top. The tops line up.
- For the bottom visuals, click Align bottom.
- To make equal spacing, click Distribute horizontally (or vertically).
Use the canvas guide lines
Power BI shows guide lines when visuals line up. Before, this feature did not exist and you had to estimate.
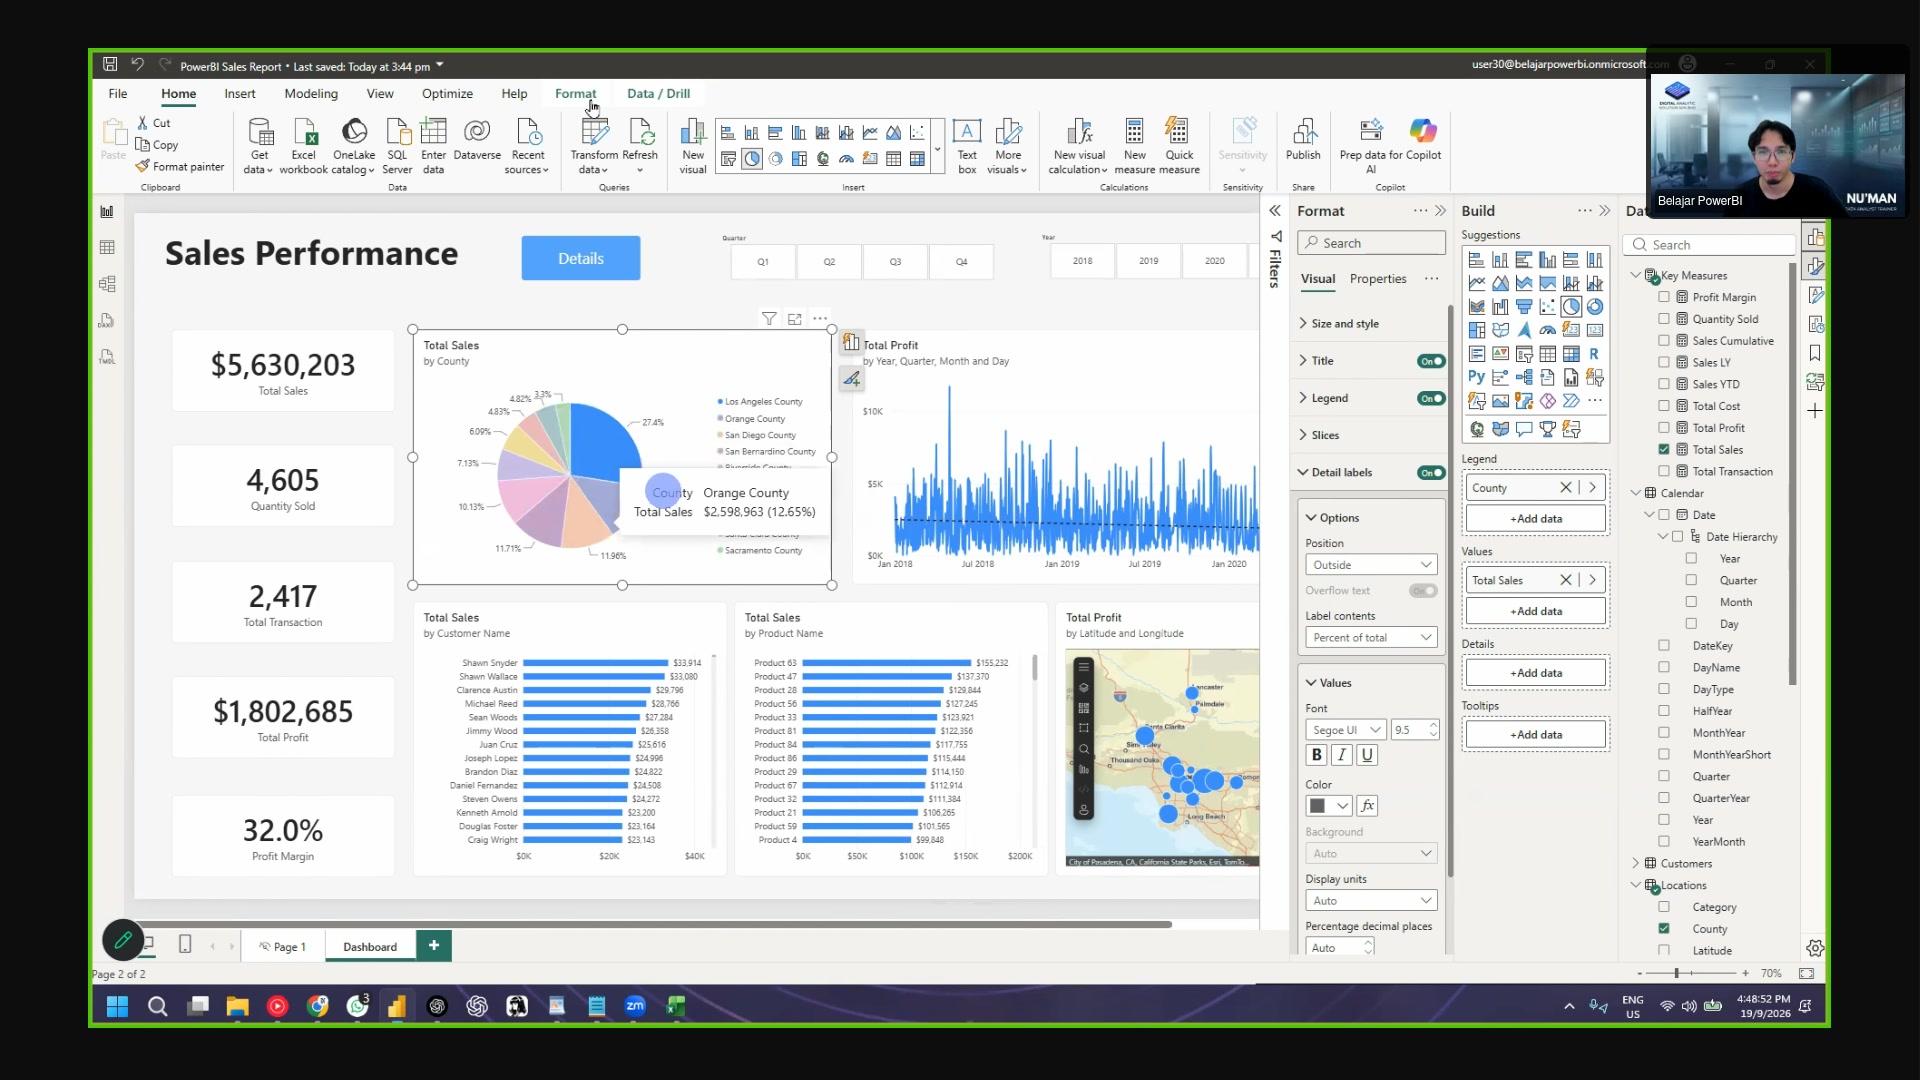 The dashboard after layout work.
Step 10: Set the visual interactions
By default, every visual filters every other visual. Sometimes this changes a number you do not want to change.
Example: the big Total Sales card must not change when the reader clicks a county. It must always show the grand total.
- Click the visual that drives the filter (example: the donut chart).
- Click Format > Edit interactions.
- Small icons appear at the top corner of every other visual:
- Filter icon: the visual filters.
- Highlight icon: the visual highlights.
- None icon: the visual does not react.
- Click the None icon on the visual that must stay fixed.
The change is one-way
Edit interactions changes one direction only. If you also want the reverse direction, set it on the other visual too.
- When you finish, turn Edit interactions off again. Do not leave the icons on the screen.
Step 11: Make a drillthrough page
A drillthrough page shows the detail behind a number. Example: right-click a county, click Drill through, and see the customer list.
- Click + to add a new page.
- Rename the page Detail.
- In the Visualizations pane, open Format > Page information.
- Set Page type to Drillthrough.
- In the Drill through from field, add County.
- Add a table visual with these fields:
- County
- Customer Name
- Product Name
- Category
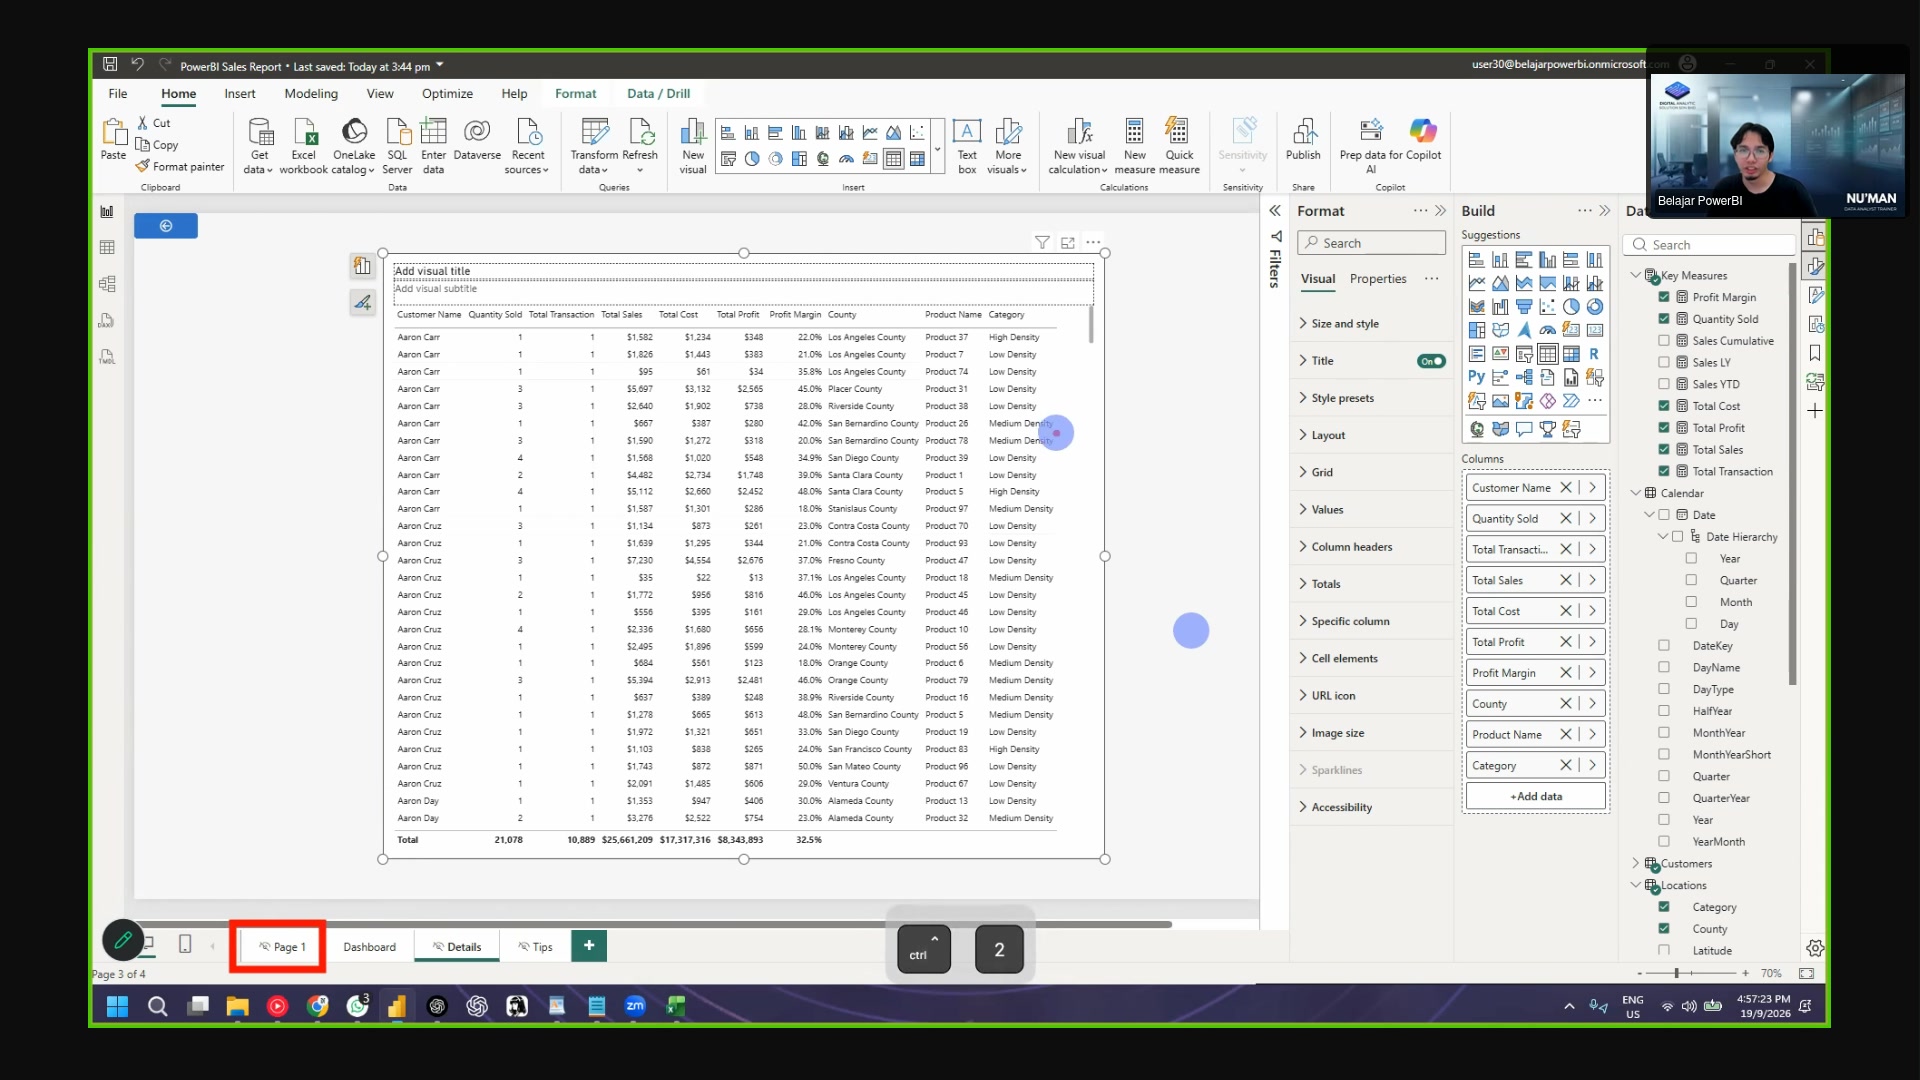 The drillthrough page setup.
- Go back to the dashboard page.
- Right-click a county in the donut chart.
- Click Drill through > Detail.
The Detail page opens with the values for that county.
Right-click drillthrough
Right-click the data point to see the Drill through menu. The menu lists every drillthrough page.
Step 12: Check the dashboard
- Click each slicer value. The visuals must change.
- Hover the map. The tooltip must appear.
- Right-click a county and test the drillthrough.
- Zoom out. The layout must look clean.
- Save the file.
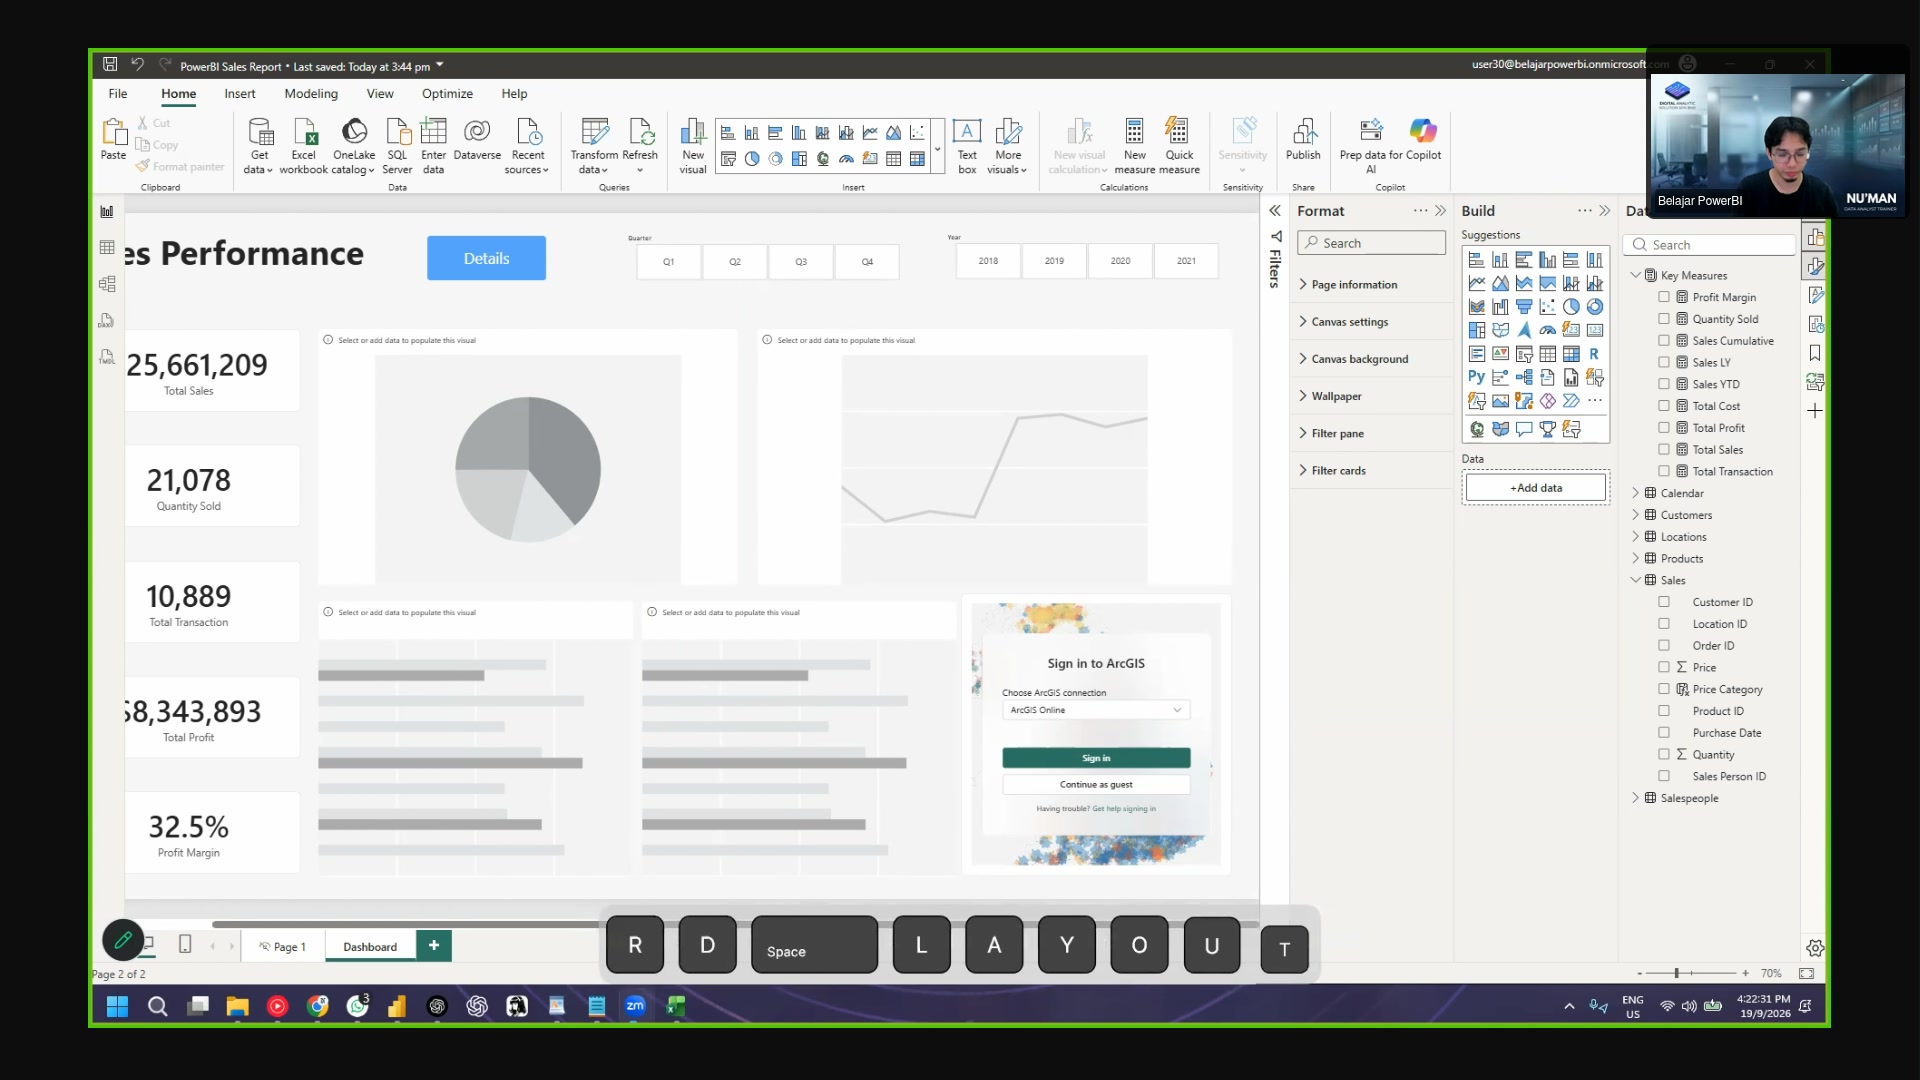 The Sales Performance dashboard. KPI cards on the left, charts on the
right.
About publish to the Power BI Service
The trainer speaks about the Power BI Service in the introduction. The class publishes at the end. The recording ends at the drillthrough step. The publish steps are in the Power BI documentation.