14. DAX Measures
Goal: Write your own formulas for sales numbers. Use DAX.
You can let Power BI add numbers for you (implicit measures). But the better way is to write the formula yourself. A written formula is an explicit measure.
Why write measures? These reasons:
- You can use the same formula on many visuals.
- The visual names stay short. You do not rename the values each time.
- All formulas live in one table. You can find them fast.
Step 1: Make a table for the measures
Measures can sit in any table. But that makes them hard to find. Make one empty table for all measures.
- Click Home > Enter Data.
- The window shows one empty column (Column 1).
- Rename the table: Key Measures.
- Click OK.
- Click Close & Apply in Power Query.
Now you have a table named Key Measures. The table has no data. It only holds formulas.
Step 2: Write the first measure — Quantity Sold
- In the Data panel, right-click Key Measures.
- Click New Measure. A formula bar appears.
- Type the name: Quantity Sold.
- Type = after the name.
- Start to type SUM. Power BI shows a suggestion. Press Tab.
- Select the column: Sales[Quantity].
- Close the bracket.
The formula:
Quantity Sold = SUM(Sales[Quantity])
- Press Enter.
Write the table name with the column
In DAX, write the table name and the column name together: Sales[Quantity]. Do not write the column alone. Two tables can have columns with the same name.
The new measure has a small calculator icon. It is ready to use.
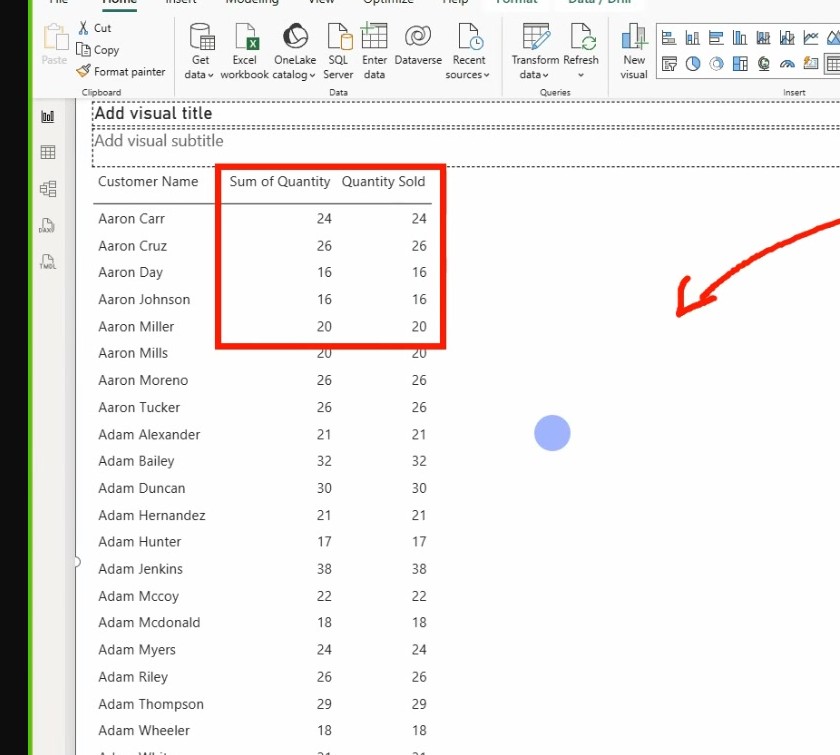 The new Quantity Sold measure next to Sum of Quantity. The values are
the same. The red box shows the proof.
Step 3: Add the measure to a table
- Click the table visual.
- Check the Quantity Sold measure.
- Remove the old Sum of Quantity column.
The result is the same as the implicit measure. But now you decide the numbers, not Power BI.
Step 4: Write Total Sales (row by row)
Quantity Sold adds one column. Total Sales multiplies two columns: price times quantity. You cannot use plain SUM for this. Use SUMX.
Why SUMX
SUM adds one column. SUMX works row by row. It multiplies the two values in each row, then adds the results.
- Right-click Key Measures > New Measure.
- Type this formula:
Total Sales = SUMX(Sales, Sales[Quantity] * Sales[Price])
- Press Enter.
- Add the measure to the table visual.
Step 5: Write Total Cost (lookup from another table)
The cost value is in the Products table. The quantity value is in the Sales table. Use RELATED to get the cost.
RELATED is a lookup
In Excel you use VLOOKUP. In DAX you use RELATED. RELATED follows the model relationship. It gets the value from the related table.
- Right-click Key Measures > New Measure.
- Type this formula:
Total Cost = SUMX(Sales, Sales[Quantity] * RELATED(Products[Cost]))
- Press Enter.
The result must match the Excel calculation.
Step 6: Write Total Profit and Profit Margin
Profit = Sales minus Cost. Write the profit measure in one step:
- New measure. Type this formula:
Total Profit = [Total Sales] - [Total Cost]
How to write a measure inside a formula
Write the measure name alone, inside square brackets: [Total Sales]. Do not write the table name for a measure.
- Write the margin measure. Margin = Profit / Sales:
Profit Margin = [Total Profit] / [Total Sales]
- For percent format, click the measure. Then click % in the format list.
Step 7: Write Total Transaction
- New measure. Type this formula:
Total Transaction = COUNTROWS(Sales)
COUNTROWS counts the rows in the Sales table.
Step 8: Delete the empty column
The Key Measures table still has the empty Column 1 from Step 1.
- Right-click Column 1.
- Click Delete.
- Click Yes to confirm.
The table is now empty in the table view. This is normal. Do not worry when the Key Measures table looks empty. The measures live in the formula bar, not in the table.
All measures of this class
| Measure | Formula | What it does |
|---|---|---|
| Quantity Sold | SUM(Sales[Quantity]) |
Adds all quantities |
| Total Sales | SUMX(Sales, Sales[Quantity] * Sales[Price]) |
Price times quantity, row by row |
| Total Cost | SUMX(Sales, Sales[Quantity] * RELATED(Products[Cost])) |
Quantity times product cost |
| Total Profit | [Total Sales] - [Total Cost] |
Profit in ringgit |
| Profit Margin | [Total Profit] / [Total Sales] |
Profit as a percent |
| Total Transaction | COUNTROWS(Sales) |
Number of sales rows |
Optional: let AI write the DAX for you
The class shows a method to ask an AI tool (ChatGPT, Copilot) for DAX formulas. The AI must first learn your data model. The TMDL script gives the model to the AI.
Step 1: Export the data model as a TMDL script
- Go to Model view.
- Right-click on the model background.
- Click Script TMDL to Script Tab.
- A long code window opens. It shows tables, columns, measures, and relationships.
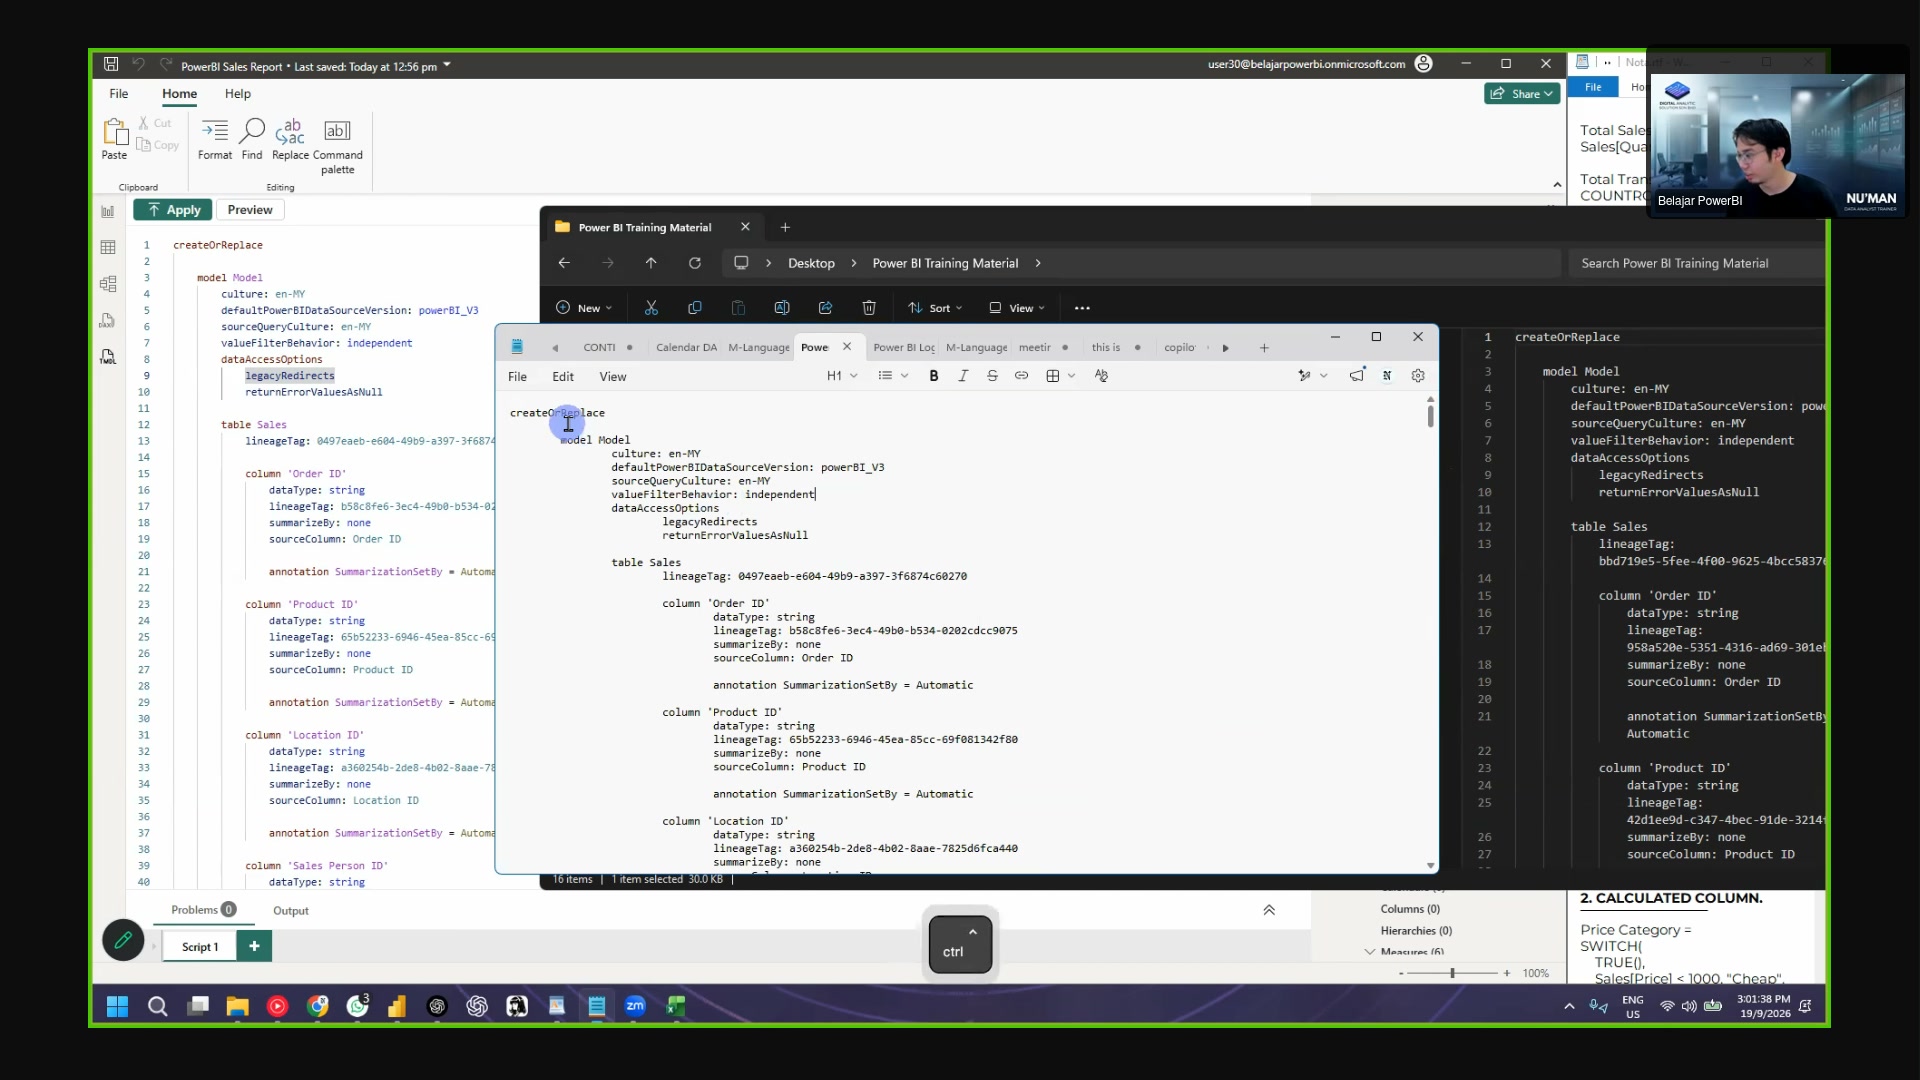 The TMDL script window.
Step 2: Save the script in a text file
- Press Ctrl+A to select all the code.
- Press Ctrl+C to copy it.
- Open Notepad (or any text editor).
- Press Ctrl+V to paste the code.
- Save the file. Name example:
Power BI data model.txt.
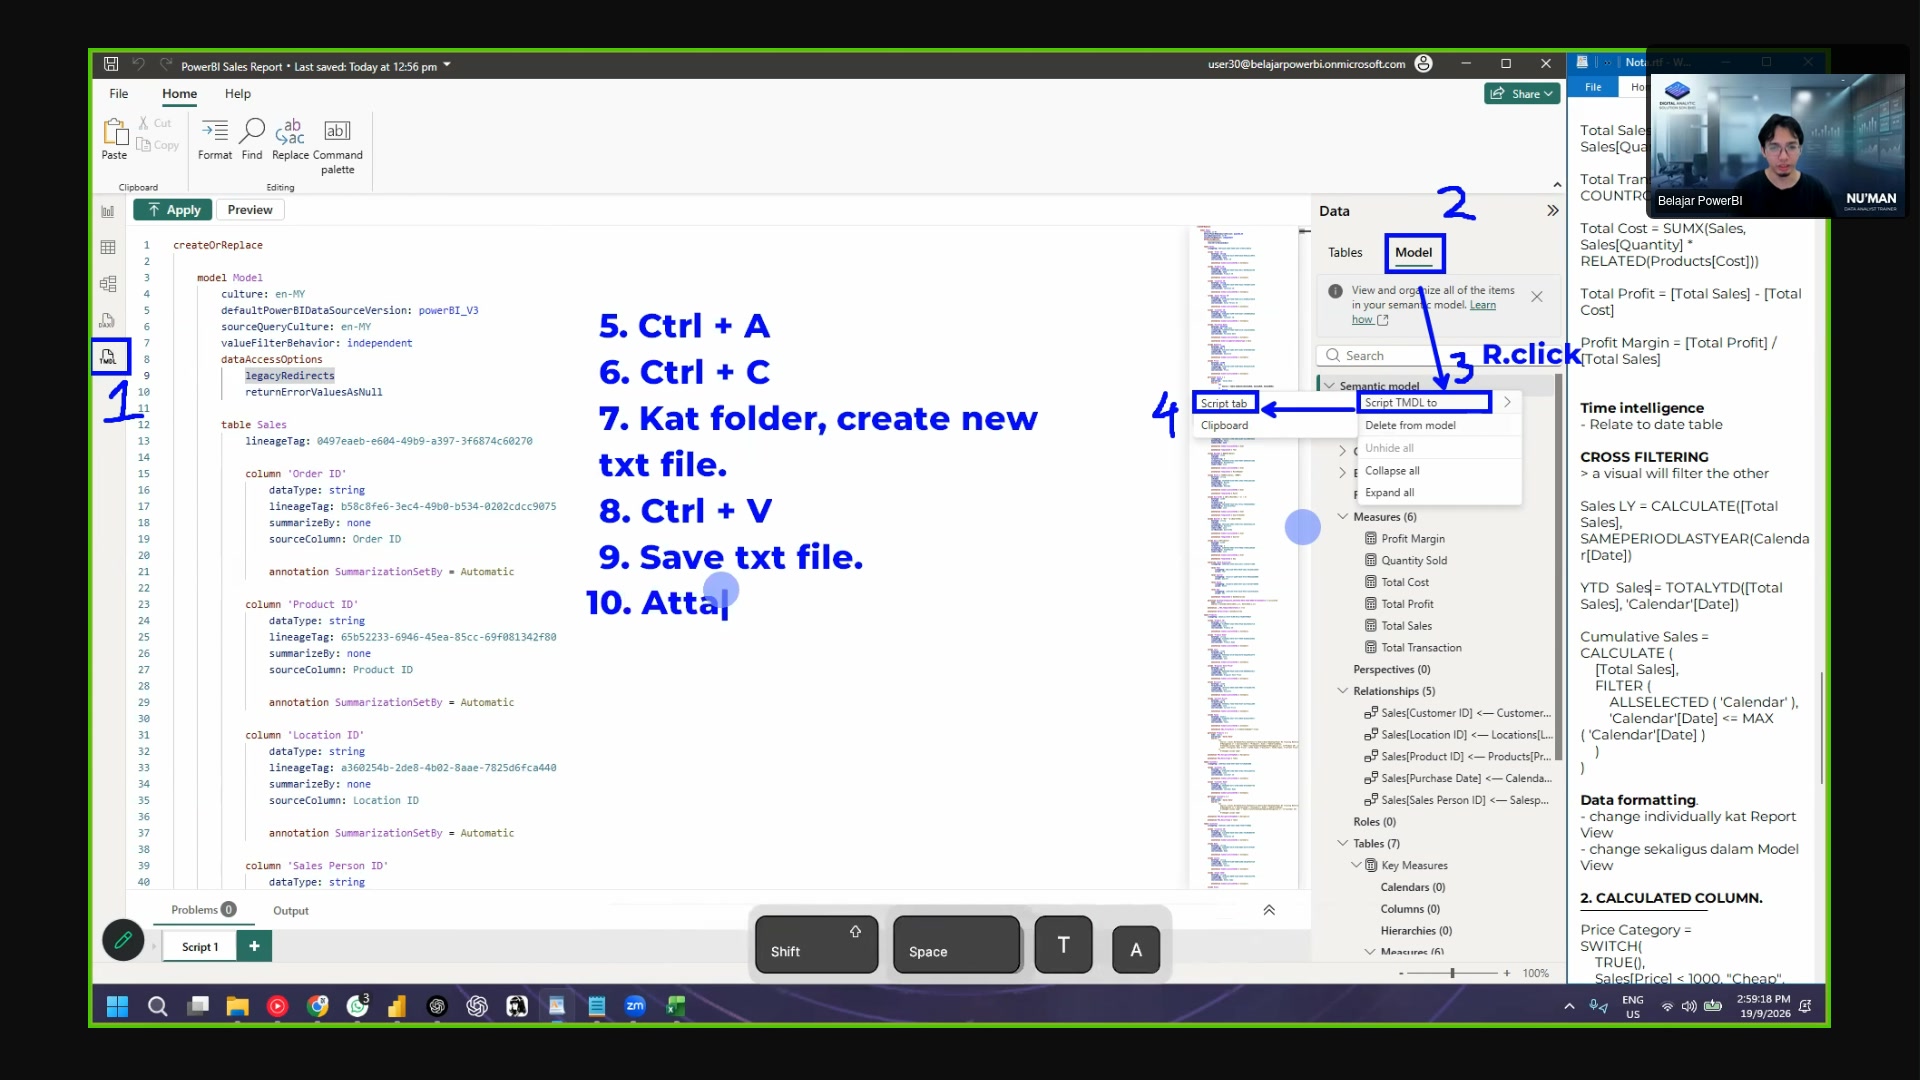 The trainer's step list. The red numbers 1-10 show the full flow.
Step 3: Ask the AI
- Open your AI tool.
- Attach the text file.
- Ask your question. Example: "Add Sales LY (last year) and Sales YTD (year to date) measures to Key Measures."
- Copy the code the AI gives you.
Use only approved AI tools
Use an AI tool that your company permits. Do not upload company data to an unapproved tool.
Step 4: Test the AI code
- In Power BI, open DAX Query View.
- Add a new query. Paste the code from the AI.
- Click the run button.
- The result appears in a table below.
Check DEFINE at the top
The code must start with the word DEFINE. If the word is missing,
add it. The query does not run without it.
Step 5: Verify the numbers
- Compare the AI result with a number you can check by hand.
- Example: Sales LY for 2018 is empty (no 2017 data in this dataset).
- Sales LY for 2019 shows the 2018 values.
AI can be wrong
AI writes a formula that looks correct but is not always correct. Always check the result. If the AI fails, write the DAX by hand.
Format the measures
- Click the measure name in the Data panel.
- In the ribbon, find the format fields.
- Profit Margin: click the % button.
- Quantity Sold: set 0 decimal places (remove the comma).
- Total Transaction: set 0 decimal places.
| Measure | Format |
|---|---|
| Quantity Sold | Whole number |
| Total Sales | Whole number |
| Total Profit | Whole number |
| Profit Margin | Percentage, 0 decimals |
| Total Transaction | Whole number |
Format the date column
- Click the Date column in the Calendar table.
- In the ribbon, open the format list.
- Choose the date format. Example:
dd/mm/yyyy.
Codes: M = month, Y = year, D = day, MMM = Jan, MMMM =
January.
Format many measures at one time
- Go to Model view.
- Select the currency measures: Total Sales, Total Profit, Total Cost, Sales LY, Sales YTD. Hold Ctrl to select more than one.
- In the Properties panel, open Format.
- Select Currency. Set the decimal places to 0.
- Select the format: English (US).
One change formats all the selected measures.
Optional: a calculated column with SWITCH
A calculated column makes a new column inside a table. Use the DAX function SWITCH for if/else logic.
- Go to Data view.
- Right-click the Sales table.
- Click New Column.
- Type this formula:
Price Category =
SWITCH(
    TRUE(),
    Sales[Price] < 100, "Cheap",
    Sales[Price] > 2000, "Expensive",
    "Normal Price"
)
How SWITCH works
SWITCH reads top to bottom. The first true condition wins. The last value is the "else" result.
Result in the data:
| Price | Category |
|---|---|
| RM 50 | Cheap |
| RM 500 | Normal Price |
| RM 2500 | Expensive |
Calculated column or Power Query?
| Point | Calculated column (DAX) | Power Query |
|---|---|---|
| Runs | In the Power BI engine (virtual) | At refresh time (physical) |
| Speed | Slower on big data | Faster, prepared in advance |
| Best for | Advanced logic | Simple, repeatable clean-ups |
| Edit | In DAX | With clicks in the UI |
The preference: do the easy steps in Power Query. Use DAX for the advanced logic.
Next: Continue to 15. Visualizations.