12. Data Model
Goal: Load the data into Power BI. Check the relationships and arrange the star schema.
Step 1: Load the data
- In Power Query, click Home > Close & Apply.
- Power BI loads the data. A progress bar shows the status.
- When the load finishes, the Report view appears.
The load completes the ETL process:
Extract (Excel) -> Transform (Power Query) -> Load (Power BI)
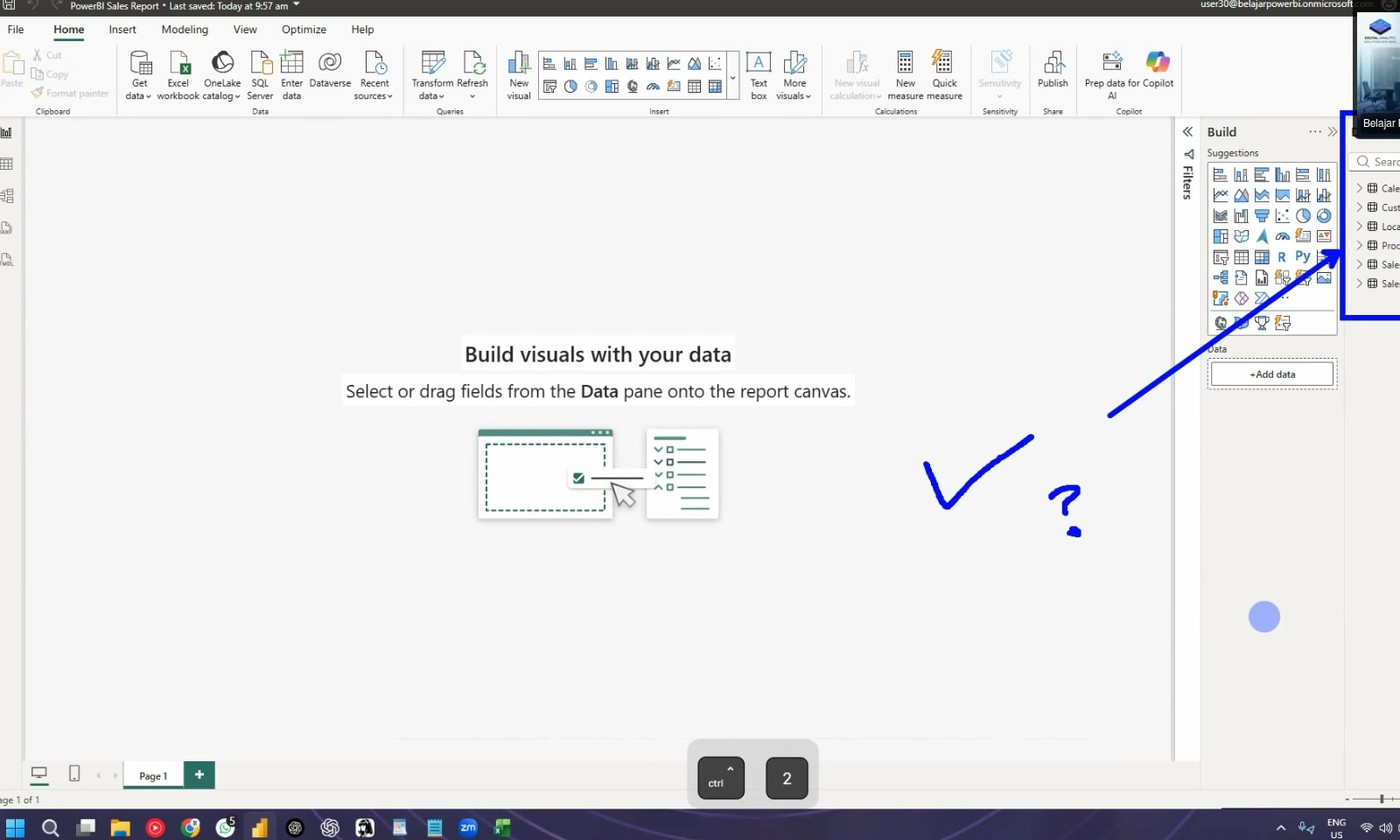 The tables after Close & Apply.
Step 2: Check the tables
- Look at the Data panel on the right.
- Count the tables. You must have six:
- Calendar
- CA Population (if you merged it into Location, it is inside Location)
- Customers
- Location
- Products
- Sales
Step 3: Group the queries (optional)
When a project has many tables, use query groups.
- In Power Query, right-click in the Queries panel.
- Click New Group.
- Name it Sales Data.
- Make a second group: Supporting Data.
- Drag the tables into the correct group.
This step keeps the project tidy.
Step 4: Open Model view
- Click the Model view icon on the left side of Power BI.
- The relationships between the tables appear as lines.
Step 5: Check the relationships
Power BI detects most relationships automatically from the matching columns.
- Look at the line between Sales and Customers.
- The line end shows 1 at the Customers side and * (many) at the Sales side.
This is a one-to-many relationship:
| Table | Cardinality | Why |
|---|---|---|
| Customers | 1 | Each customer ID appears one time |
| Sales | Many | One customer buys many times |
The same rule applies to Location, Products, and Calendar.
Step 6: Create the Calendar relationship
If Power BI does not create this relationship, make it by hand:
- In Model view, find the Calendar table.
- Click and hold the Date column.
- Drag it to the Purchase Date column in the Sales table.
- Power BI draws a new relationship line.
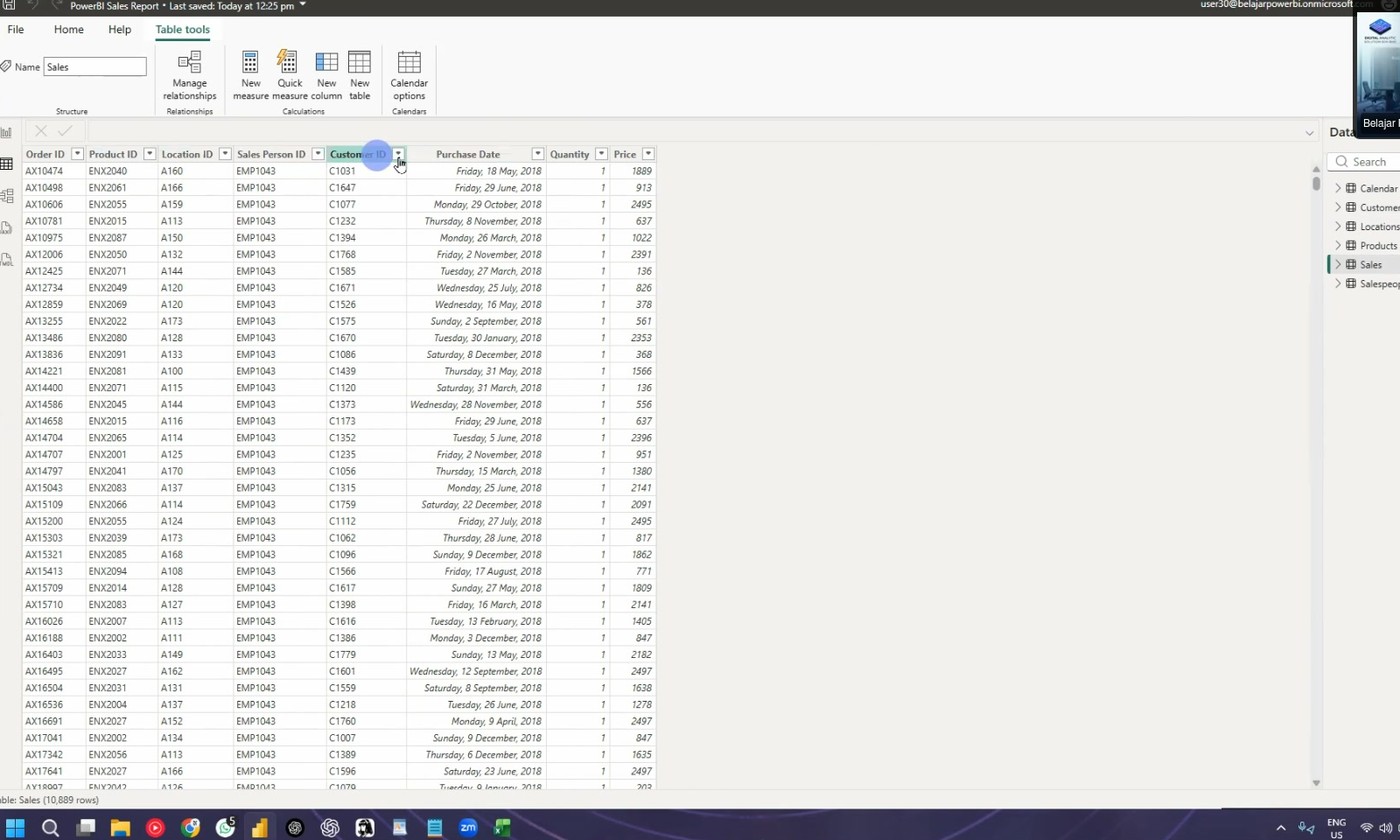 The model view: Sales in the center, dimension tables around it.
Step 7: Arrange the model
- Drag the Sales table to the center.
- Place the dimension tables around it: Calendar, Customers, Products, Location.
- Zoom out if the tables are too large.
The layout is a star: one fact table in the center, dimension tables around it.
Fact vs dimension
- Fact table: has numbers and many rows. Example: Sales.
- Dimension table: has descriptions. Example: Products.
- A project needs at least one dimension table. It can also work with no dimension table.
Delete carefully in Model view
If you delete a table in Model view, Power BI also deletes it in Power Query. The data model is the source of truth. If this happens, close Power BI without saving, then open it again.
Step 8: Save your work
- Click File > Save as.
- Choose a folder.
- Name the file PowerBI Sales Report.
- Click Save.
Save often
Save the file after each big step. Power BI does not have automatic recovery for all changes.
Next: Continue to 13. Report View and Tables.