15. Visualizations and Interaction
Goal: Build your first charts. See how visuals interact with each other.
Step 1: Make a new table visual
- Click the empty space on the report canvas. This clears the current selection.
- Click the Table icon to add a new table visual.
- Add Date from the Calendar table.
- Add Total Sales from the measures.
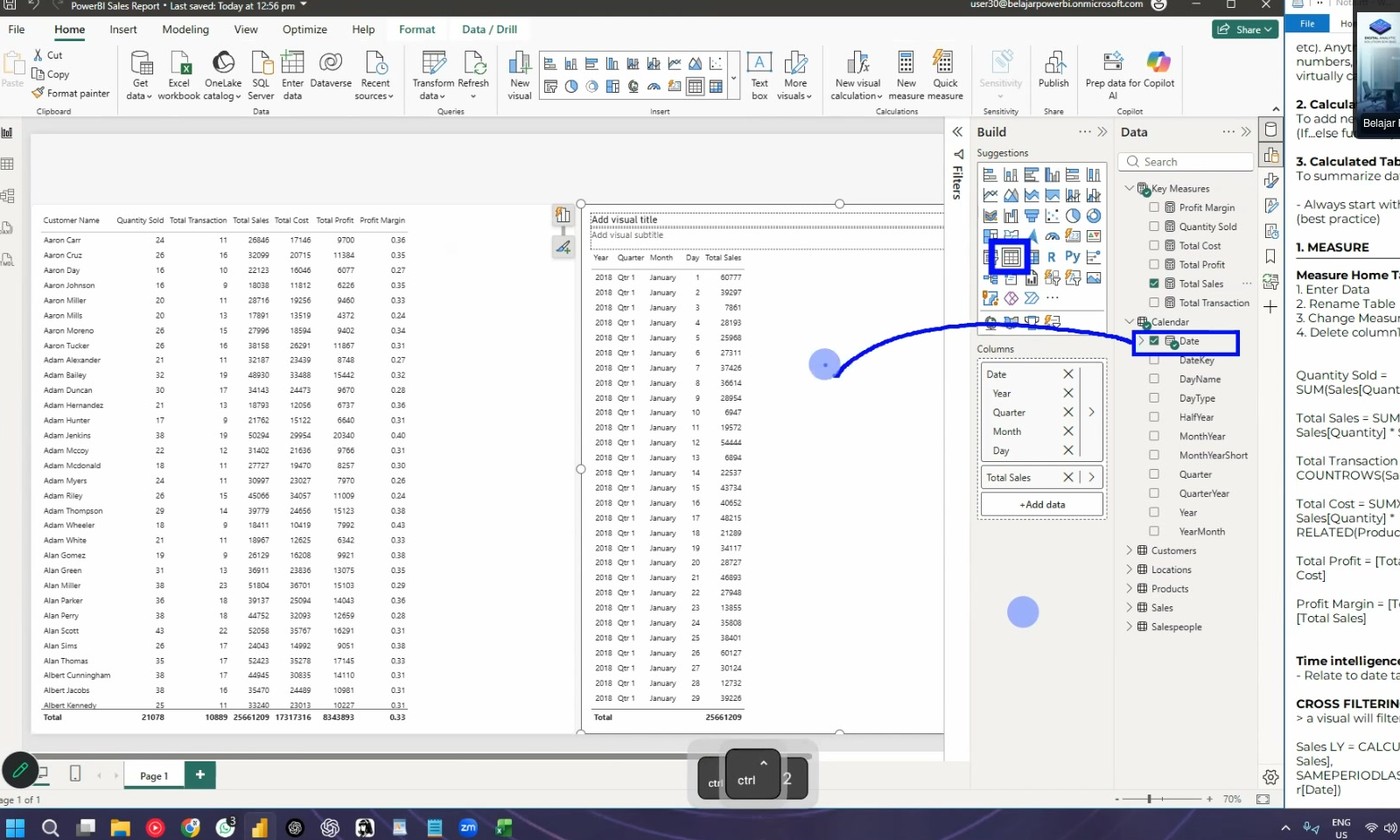 A table with the date and the total sales.
Step 2: Fix the date format (if needed)
If the Date column shows a wrong format or a text value:
- Go to Data view or the table view.
- Find the Calendar table.
- Click the Date column.
- In the top ribbon, click Data type.
- Select Date.
The relationship problems go away after the type change.
Wrong data type stops relationships
A text date cannot connect to a date column. Power BI shows wrong numbers or an error. Check the data type when a relationship looks broken.
Step 3: See the interaction between visuals
- Put the customer table visual on the left.
- Put the new date and sales table visual on the right.
- Click a date in the right table. Example: 4 January.
The left table changes. Only the customers of that date stay visible. The other numbers dim.
This is interaction (cross-filtering). One visual filters another visual.
Interaction is hard in Excel
This live filtering is difficult to do in Excel. In Power BI it happens with one click.
Step 4: Check a total with the model
- Click one date in the date table.
- Read the total sales for that date.
- Compare it with the daily total in the big table.
Both numbers must match. This is the proof that the model works.
Step 5: Make a chart
- Click the Line chart icon in the Visualizations panel.
- Add Date to the X-axis. Use the Date column (one column, not the year-quarter-month-day hierarchy).
- Add Total Sales to the Y-axis.
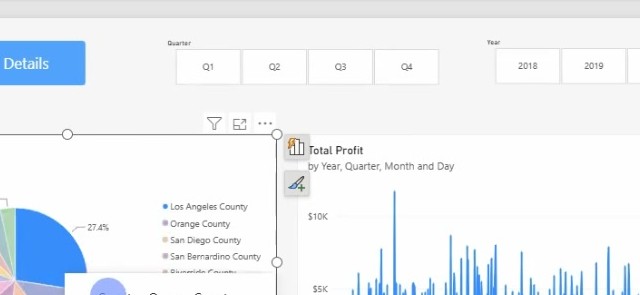 A line chart of daily sales.
Use the date column, not the hierarchy
Power BI builds a hierarchy from a date column: year, quarter, month, day. Drag the plain Date column if you want one point per day.
Next: Continue to 16. Dashboard.