3. Prepare Your Excel Data
Goal: Convert the raw Excel data into a table. Power BI reads tables better than plain cell ranges.
Why turn data into a table
Excel data without formatting is only a range of cells. The range can have extra notes, drawings, and empty space at the sides.
When you convert the range to a table:
- Power BI reads only the table columns.
- Extra notes and side content are not included.
- Column names stay correct when you refresh the data.
Very important
The trainer recommends this step for every Power BI project.
Step 1: Open the raw data file
- Open Raw.xlsx in Excel.
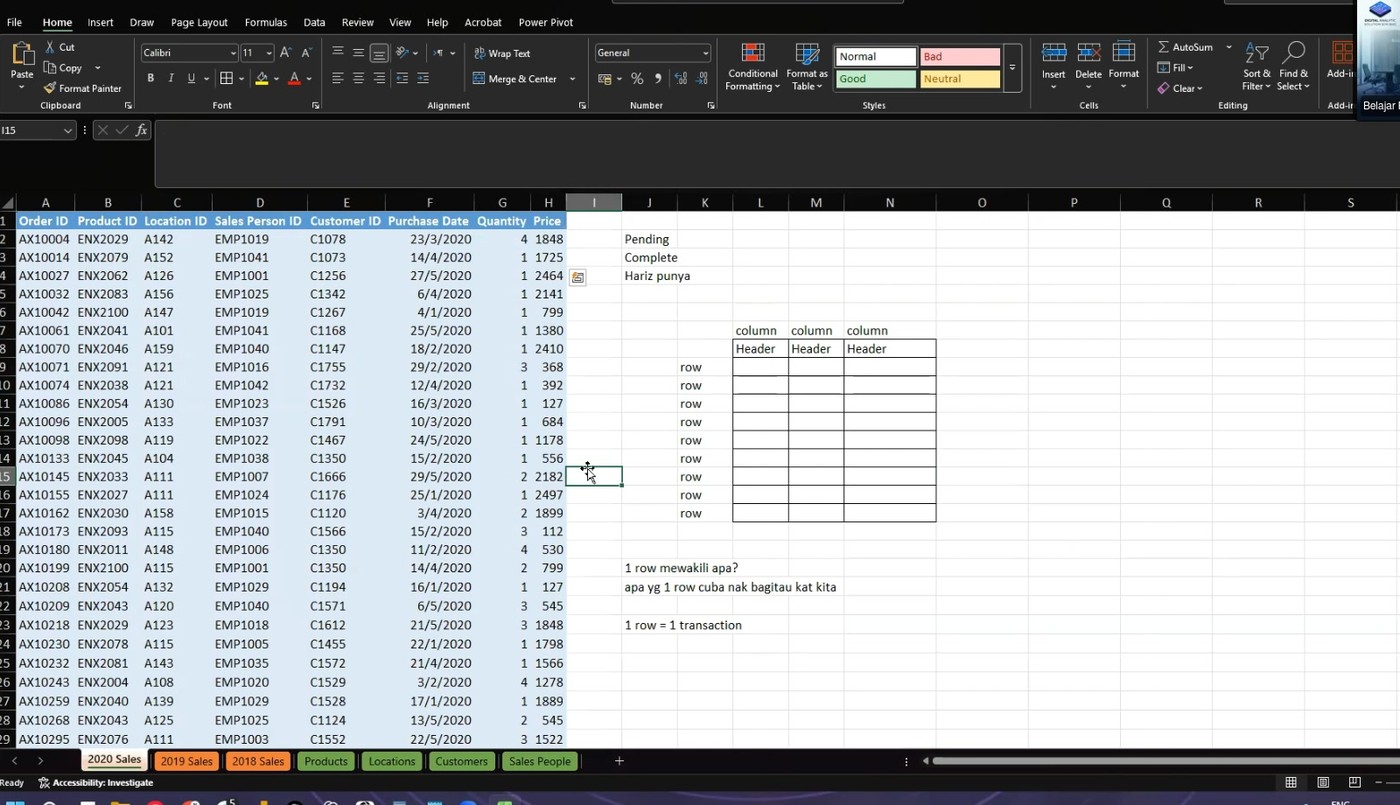
- Look at the file. It has no table formatting.
- Some cells may have notes or marks at the side. Power BI must not read these.
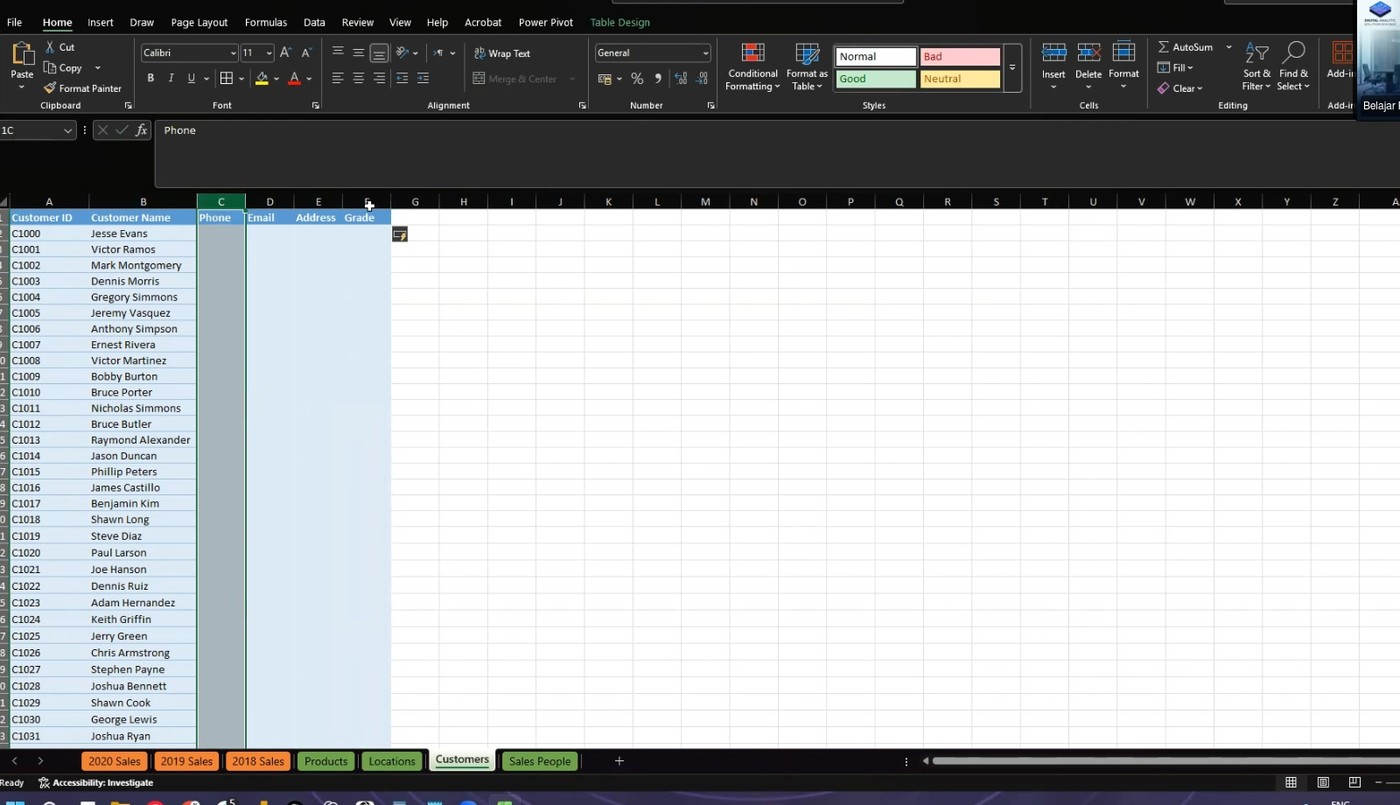 The raw data in Excel before conversion.
Step 2: Convert the range to a table
- Click any cell inside the data.
- Press Ctrl+T. The Create Table window opens.
- Check the box My table has headers if your data has column names.
- Click OK.
Excel now shows the table style. A new Table Design tab appears in the ribbon.
 The Create Table window.
Step 3: Name the table
- Click any cell in the table.
- Click the Table Design tab.
- Find the Table Name box.
- Type a clear name. Example: Sales.
- Press Enter.
The table name is important. Power BI shows this name when you import the file.
Step 4: Compare with the prepared file
- Open Dataset.xlsx.
- Click any cell inside the data.
- The Table Design tab is already there. The table is already set up.
The prepared file is the result of the steps above.
Shortcut
Ctrl+T converts a range to a table. Ctrl+Shift+L turns the filter buttons on and off.
Next: Continue to 4. Load the Data.