5. Power Query Basics
Goal: Learn the Power Query window. Find where each tool is.
Power Query is the data preparation tool. All data changes happen here, not in Excel.
The five areas of the window
- Ribbon (top). All the buttons and commands.
- Queries panel (left). The list of imported tables.
- Data preview (center). The sample view of the selected table.
- Applied steps (right). The list of steps you made. Each step is recorded.
- Formula bar (top of the preview). The M language code for the selected step.
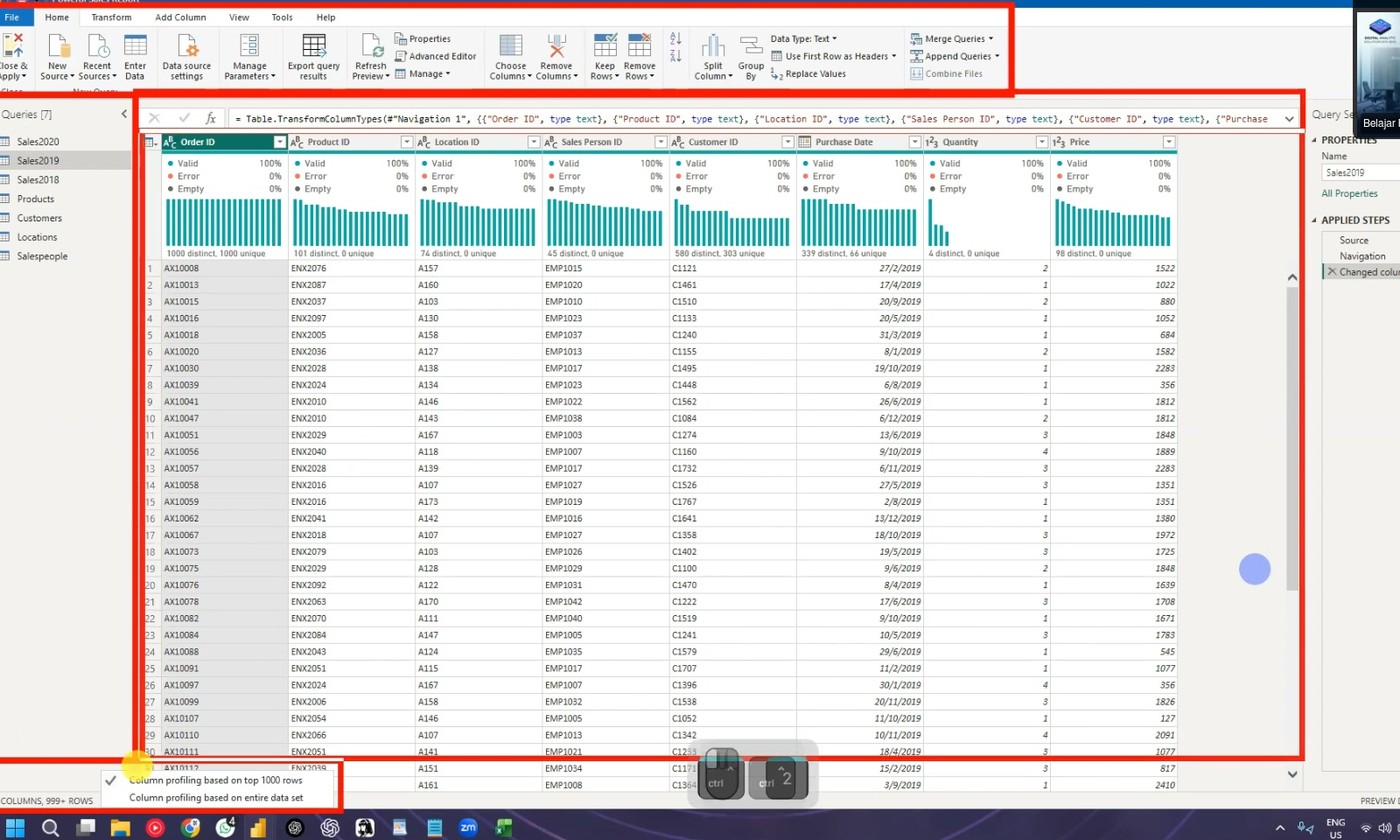 The Power Query window with its five areas.
The preview is only a sample
- Click any table in the Queries panel.
- Power Query shows the first 1000 rows.
Preview limit
The default preview is 1000 rows. The limit protects slower computers. The preview limit does not change the loaded data. Power BI still loads all rows.
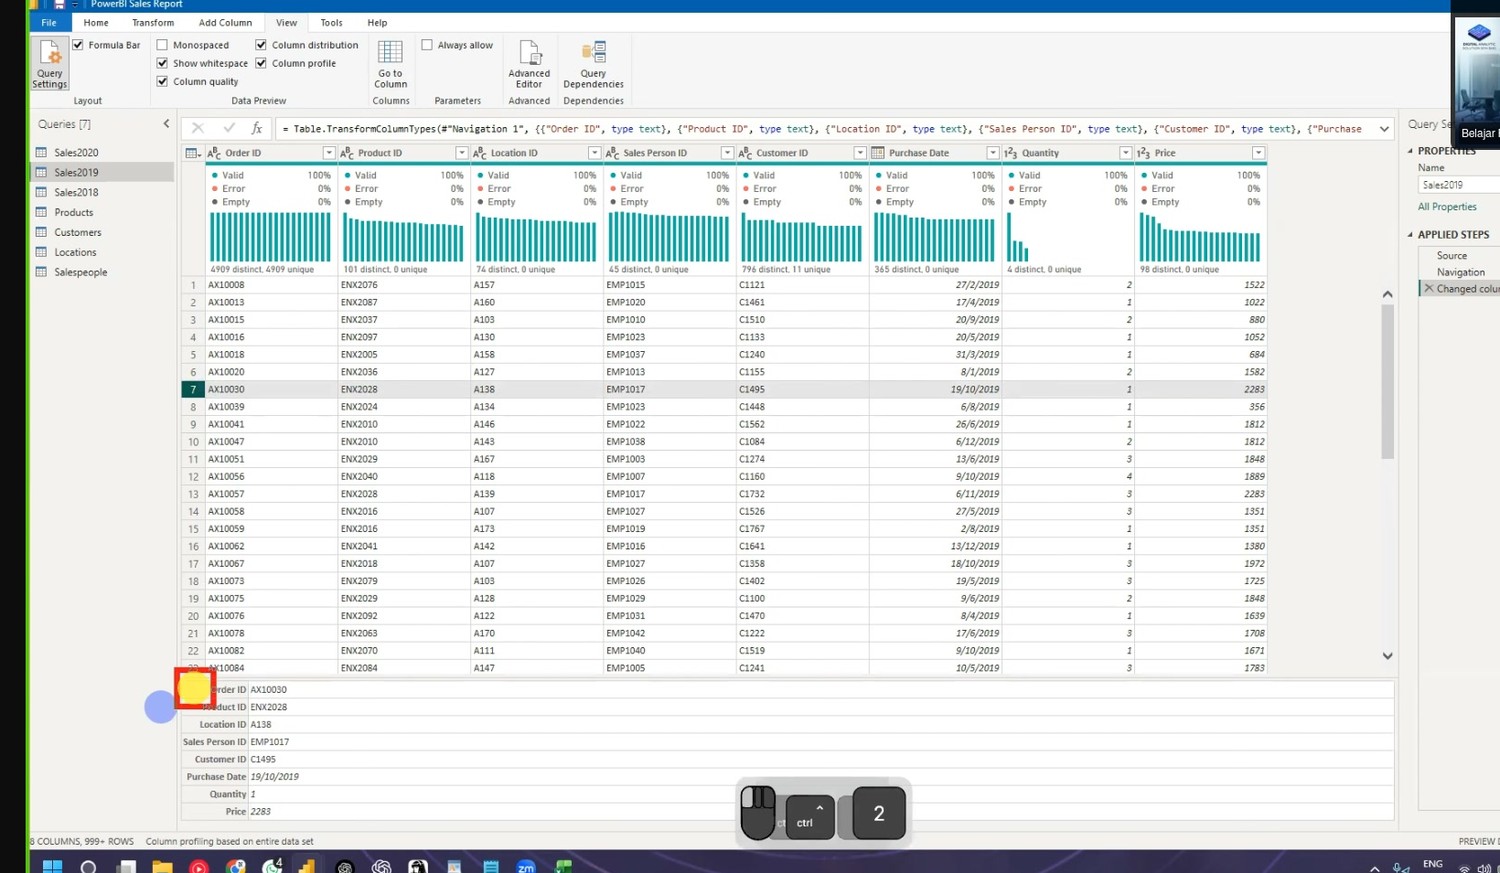 The preview shows the first 1000 rows. The status bar shows the row count.
Check column quality and distribution
- Click View in the ribbon.
- Turn on Column Quality.
- Turn on Column Distribution.
- Turn on Column Profile.
Now each column shows a small bar chart. The bar shows valid, empty, and error values.
- To see full statistics, click Column profiling based on entire dataset in the bottom status bar.
Row count
This training file has about 4900 rows. The status bar shows the count when profiling is on.
Go to a column
- Click the Go to Column button.
- Select the column name from the list.
Power Query scrolls to that column. Use this tool when a table has many columns.
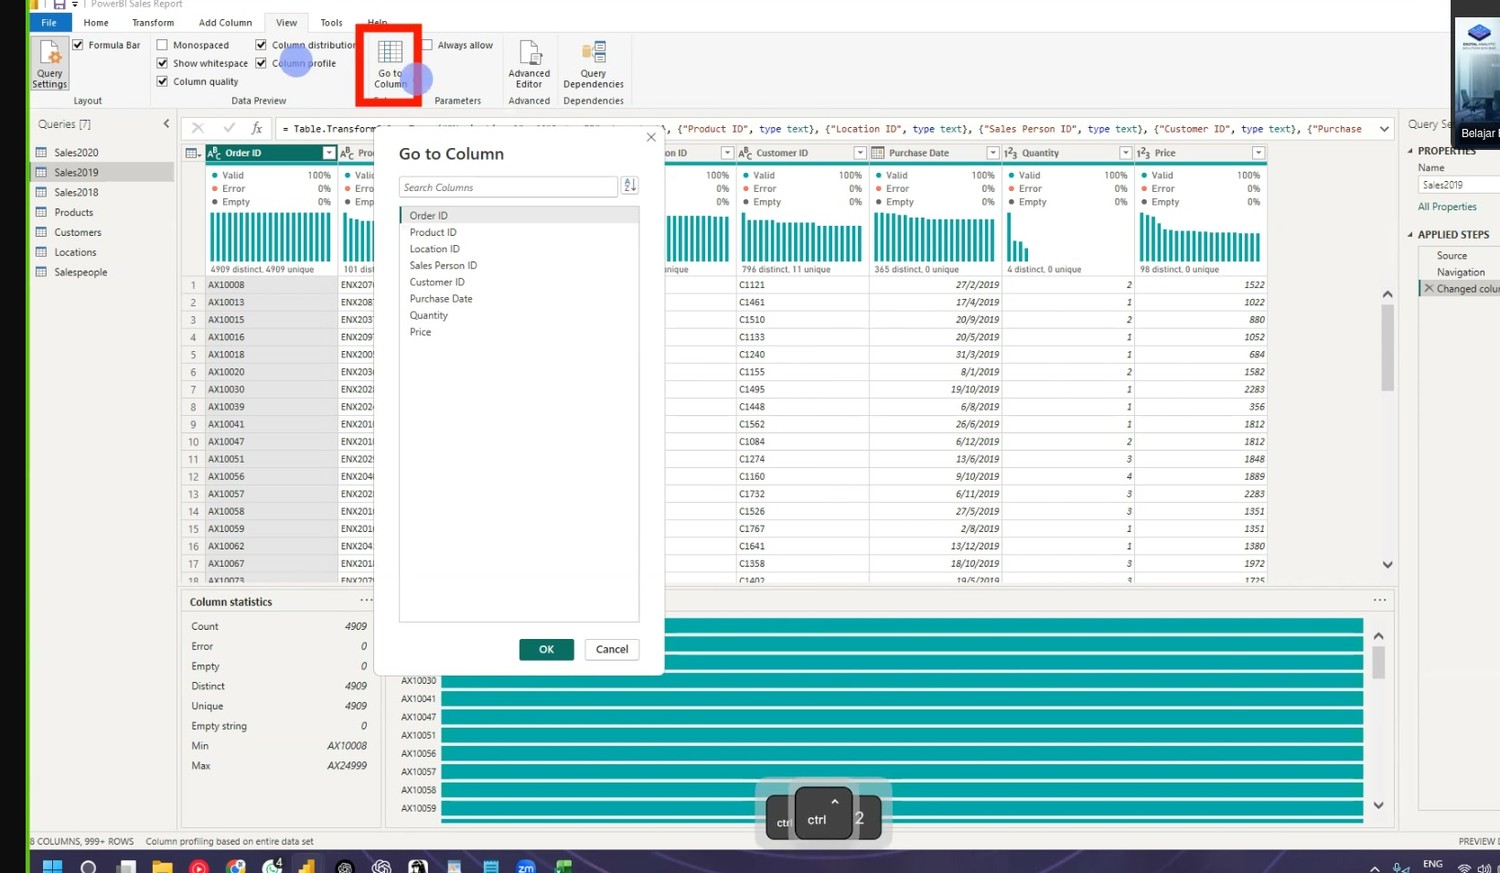 The Go to Column list. Select a column name to jump to it.
The M language
Every step you make writes M code.
- Click a step in the Applied Steps list.
- Look at the formula bar. It shows the code for that step.
Each step references the step before it. Example:
= Table.RemoveColumns(#"Changed Type",{"Time Zone"})
This code means: take the table from step "Changed Type", and remove the column "Time Zone".
No undo
Power Query has no Ctrl+Z undo. To change a step, click the step and edit the code or delete the step.
Distinct vs unique values
The trainer shares this screenshot in the Zoom chat.
Two words look the same. They are not the same:
| Word | Meaning | Example |
|---|---|---|
| Distinct | All different values in the column | A, B, C, F, G, H — 6 values |
| Unique | Values that appear only one time | B, F, G, H — 4 values |
- A value is distinct when it is different from the value before it.
- A value is unique when it is different from every other value in the whole column.
Example from the data:
- The value C is distinct (it is a different value).
- The value C also appears many times. So C is not unique.
- B appears one time only. So B is unique and also distinct.
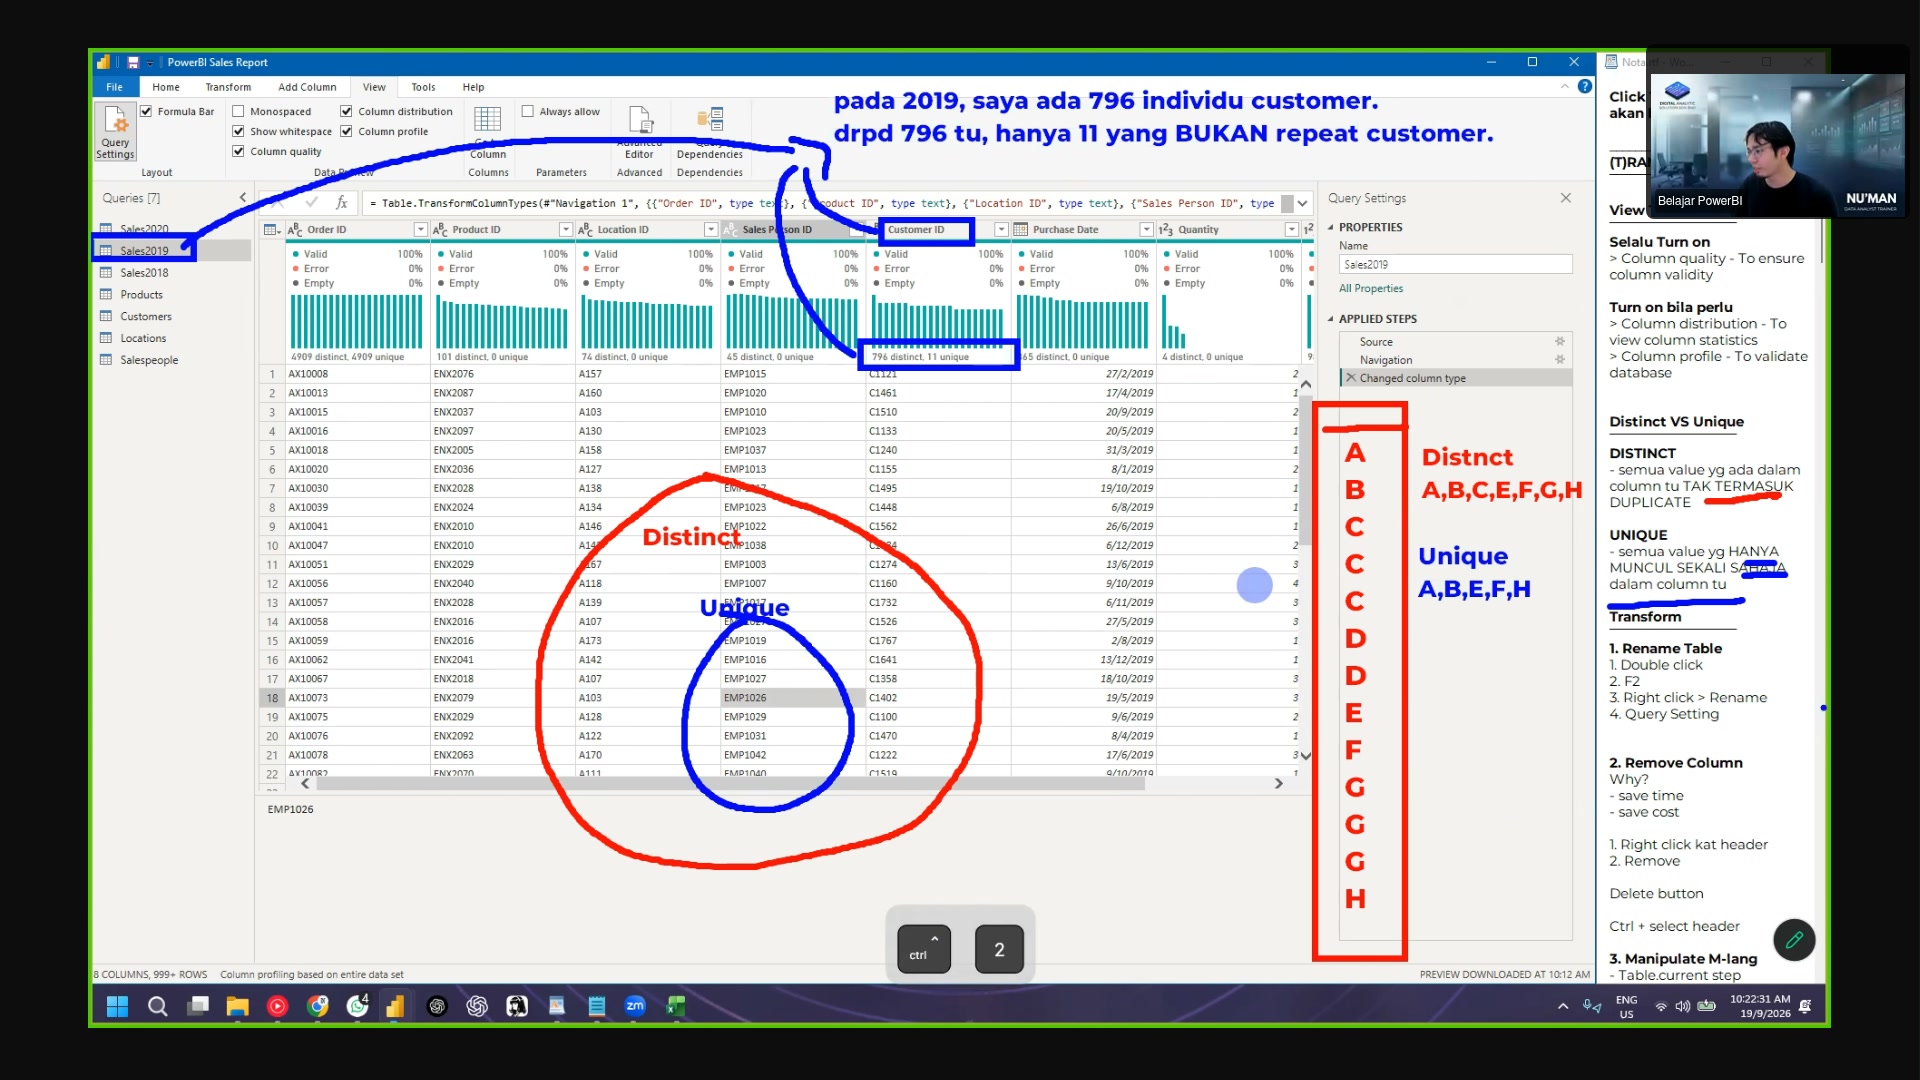 The trainer's annotation: the blue circle shows the distinct range, the
red circle shows the unique range.
Where the counts come from
Turn on Column Profile to see both counts. The profile shows "Distinct" and "Unique" for each column. Check the profile numbers before you clean a column with many duplicates.
Next: Continue to 6. Transform the Data.