13. Report View and Tables
Goal: Show data in a table visual. Learn how Power BI adds numbers for you.
Step 1: Go to Report view
- Click the Report view icon on the left side of Power BI.
- The report canvas appears. It is empty at this time.
Step 2: Add a table visual
- Click the Table icon in the Visualizations panel.
- The visual appears on the canvas. Drag it to the top-left corner.
- Make the visual about half the page wide.
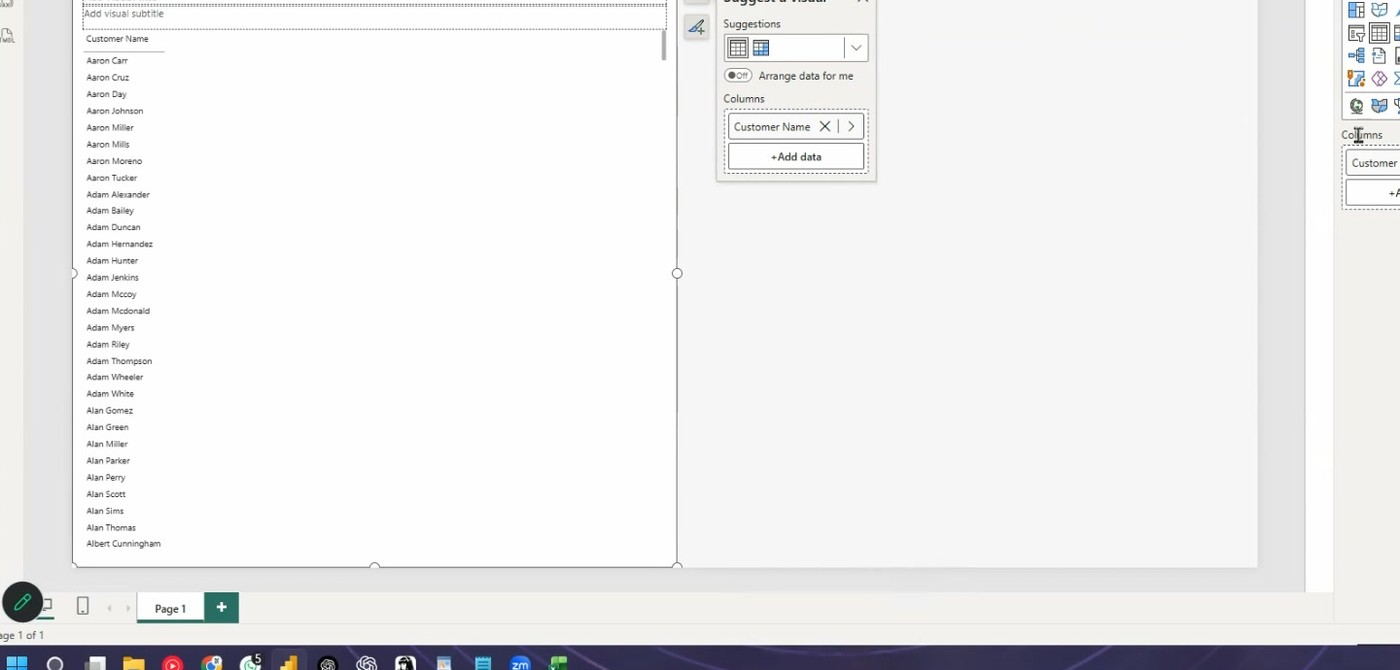 A table visual on the report canvas.
Step 3: Add data to the table
Power BI gives you two ways to add data:
| Way | Method | Speed |
|---|---|---|
| 1 | Check the boxes in the Data panel | Slow, but exact |
| 2 | Drag the column into the visual | Fast, but less exact |
- Check the Customer Name box in the Data panel. The table shows all customer names.
- Now add Quantity. The table shows two columns.
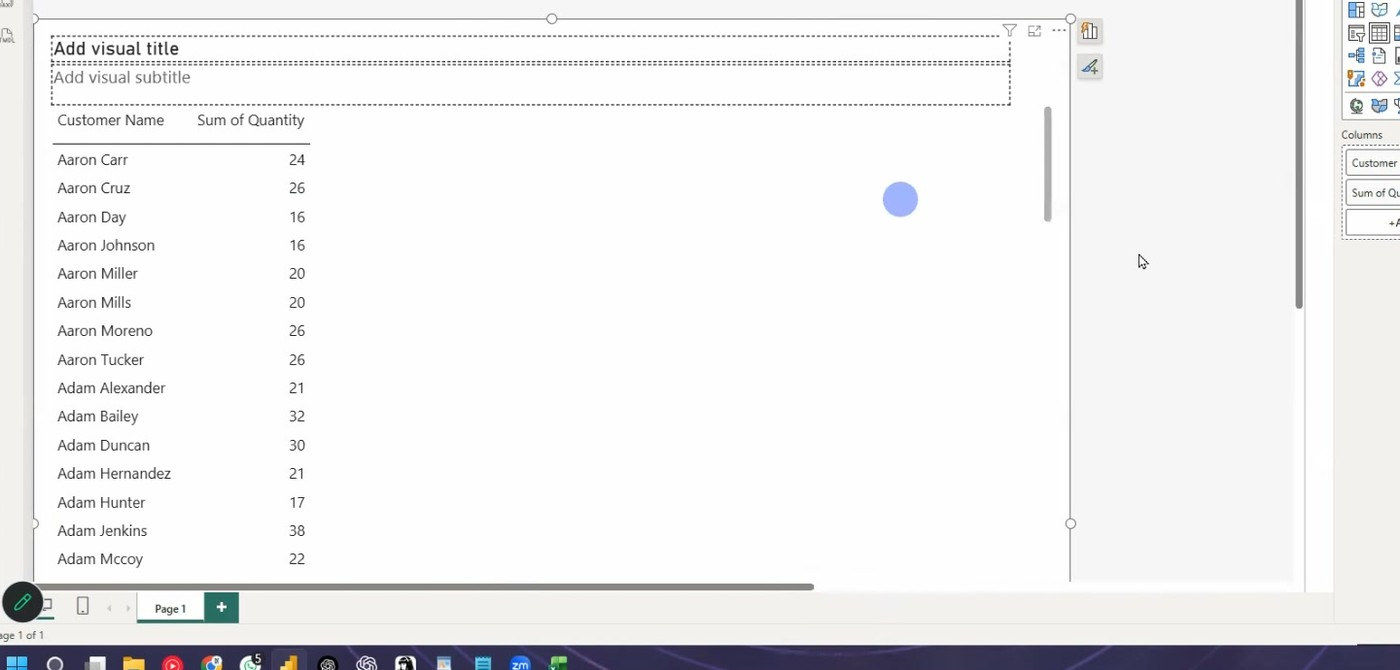 The table with two columns.
Step 4: Understand the auto-sum
Look at the Quantity column. Power BI shows Sum of Quantity, not the raw values.
Power BI adds the numbers for each customer automatically. The number icon next to the column name shows a numeric column. A calendar icon shows a date column.
Implicit measure
This automatic sum is an implicit measure. Power BI calculates it for you with no formula. Later in the class you write your own formulas. Those are called explicit measures.
Step 5: See how the calculation works
The two columns come from two different tables:
- Customer Name comes from the Customers table.
- Quantity comes from the Sales table.
Power BI connects the tables with the model relationships.
For each customer, Power BI does these steps:
- Filter the Sales table for that customer.
- Add (sum) all quantity values for that customer.
- Show the total for that customer row.
Example: the customer "air car" has a total quantity of 24.
No relationship, no numbers
Delete the relationship between Sales and Customers, and the sum breaks. Power BI cannot filter any more. Then the visual shows the same total for every customer. This is the usual sign of a missing or broken relationship.
Step 6: Save your work
- Click File > Save.
- When the class takes a break, save the file first.
Next: Continue to 14. DAX Measures.